Chapter 2 The data
Note that some of the data used in this book varies from those used by Lindeløv. Some of the test results will therefore differ.
2.1 Sample values
Most of the examples in the book are based on three imaginary samples (x, y and y2). Each is normally distributed and made up of 50 observations.
We start by creating a function that will allow us to produce samples of a given size (N) with a specified mean (mu) and standard deviation (sd):
rnorm_fixed = function(N, mu = 0, sd = 1){scale(rnorm(N))*sd + mu}Now we can create our three samples:
set.seed(40) # Set the seed so our 'random' results are reproducible

# Create the samples (use the same order as original book - y, x, then y2)
y = rnorm_fixed(50, mu=0.3, sd=2)
x = rnorm_fixed(N = 50, mu=0, sd=1)
y2 = rnorm_fixed(N = 50, mu=0.5, sd=1.5)
Let’s also combine these samples into ‘wide’ and ‘long’ data frames. This doesn’t change any of the values, it just rearranges the data into different layouts which can sometimes be easier to work with (e.g. when producing plots):
# The wide layout is a dataframe with three columns, one for each of x, y and y2
mydata_wide <- tibble(x = x, y = y, y2 = y2)

# the long layout has two columns: one listing the group to which each observation
# belongs (x, y or y2), and another column with the corresponding value
mydata_long <- mydata_wide %>%
  gather(group,value,x:y2)
Here’s what our three samples look like when plotted. Note the different mean (0.0, 0.3, and 0.5) and the different ‘spread’ of values for each group (reflecting their different standard deviations).
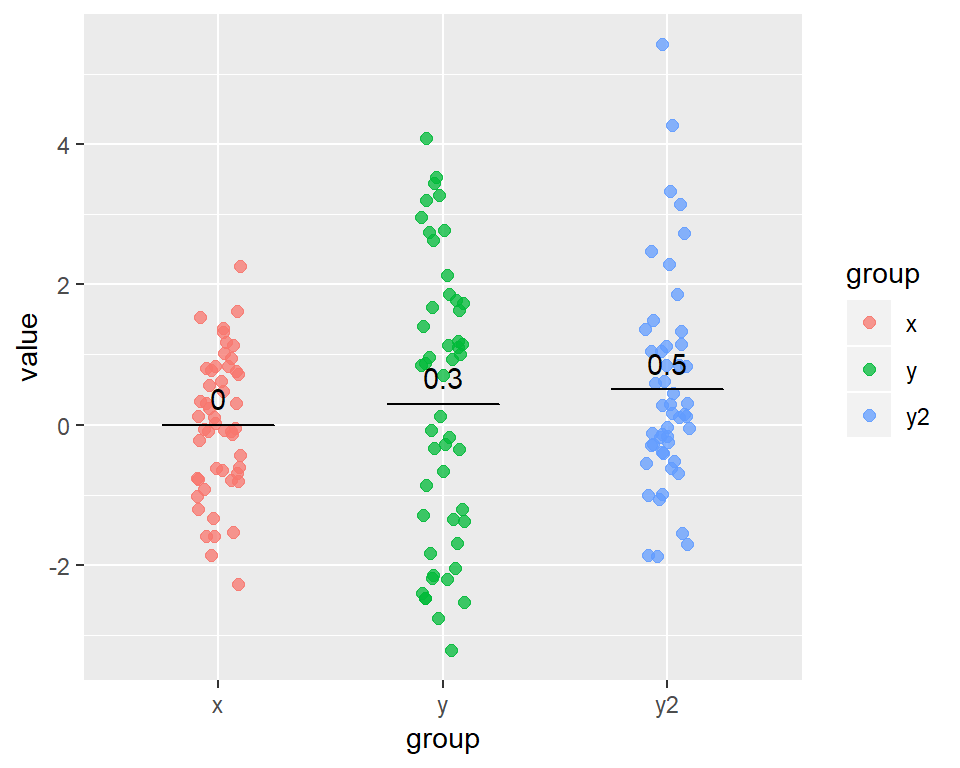
Figure 2.1: Our sample data
2.2 ‘Signed rank’ values
Most common tests demonstrated in the book use the actual values from the samples above. However, some tests (i.e. non-parametric tests) also use their rank-transformed values. In some cases, the signed rank of the values is used.
What is meant by signed ranks? The signed rank is found by:
1. taking the absolute value of each observation in the original sample; that is, expressing all the values as a positive number;
2. finding the rank of each of these absolute values, where the smallest absolute value has a rank of 1; and
3. giving each of these ranks the same sign (+ or -) as the original value.
For example, the numbers -2, 3, 7, -25, -30, 31 would have the signed ranks of -1, 2, 3, -4, -5, 6.
We create a function, signed_rank(), that we can use later to convert our actual values into signed ranks:
# Takes any list of values, x, and calculates their signed rank
signed_rank = function(x) sign(x) * rank(abs(x))